Lucas Farias
💻 Software developer at iFood
Introductory concepts of the tool and its applications
Developing services that are used by millions of users with traffic on the scale of millions is a very big responsibility. Monitoring the health, behavior and trends of application and infrastructure is an essential activity within iFood. We use some tools to help us with this task, and one of them is the Prometheus — an open source monitoring and alerting solution.
In this text, I will present introductory concepts of the tool, its main components, data models and types of statistics and usage tips.
Prometheus
Prometheus is a platform for monitoring and alerting of applications. Observing how systems are being used provides important information for planning decisions, whether engineering or business. Normally when we are monitoring something, we want to know when things go wrong. These are the two main functions of Prometheus, it doesn't try to do anything beyond that.
An interesting aspect of the ecosystem is that it is built in independent modules. The main component is the Prometheus Server who is responsible for a scraper on exposed information held by services being monitored and stored in a database time series , dynamic discovery of services that need to be monitored — which is a very important feature for elastic cloud environments — and also evaluating rules that can identify anomalies in systems behavior, sending notifications to the alert manager , which is responsible for controlling the notification process.
There are basically three ways to export statistics to the Prometheus Server :
- Client Libraries: long-lived applications, Prometheus fetches information from time to time by tapping a endpoint to collect the information normally exposed by client libraries . This is the most common way for web services, for example.
- Push Gateway: short applications, those that run just to perform a task. Background Jobs are good examples of this type of application. For these cases, these applications must notify a component push gateway which will export this information to Prometheus.
- Exporters: Third-party applications and services that do not have access to the source code, but that we wish to monitor, such as databases, hardware, messaging systems, are used exporters to set and get application data.
Prometheus does not care about creating advanced ways of visualizing metrics. Despite offering a simple web interface for consultation, it offers an API that allows information to be consulted using tools such as Grafana .
Metrics and time series database
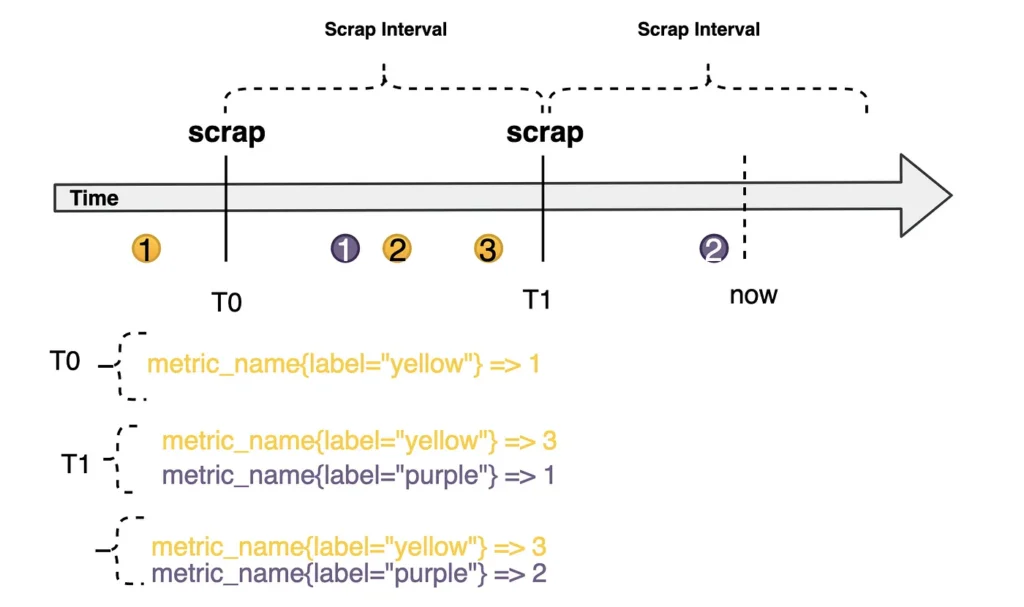
One point that I believe to be interesting is how statistics are represented. Collections stored in a series base time they can be seen as value flows at a moment in time . Representation can be seen as a identifier , a set of labels to define dimensions. The records for this metric are a stream of values called samples.
metric_name{label="value",...} = [(v0,t0), (v1,t1), ...]
The process of acquiring these samples is done using a technique called Scraping , where Prometheus makes HTTP requests to services at fixed time intervals, collecting the information exposed by the endpoint of exposure.
As a best practice, the metric name should define the functionality of the system being monitored. For example, the metric called prometheus_http_requests_total counts the total number of HTTP requests made to the Prometheus Server . The image below shows this metric in the Prometheus UI:
prometheus_http_requests_total
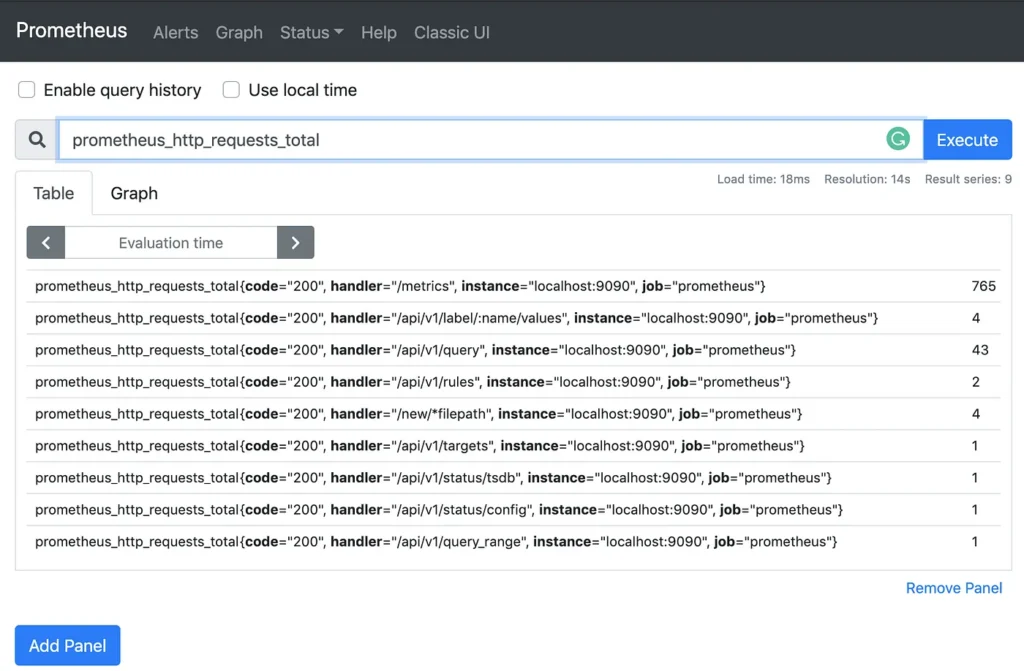
In the metric above, we have a time series set composed of the combination of dimensions (code, handler, instance and job). For example, all requests with code status 200 for the endpoint “/api/v1/query” consist of a time series of the metric prometheus_http_requests_total . This combination of dimensions is recommended - call of cardinality — be something controlled , avoiding using values that vary greatly, such as emails or user identifiers.
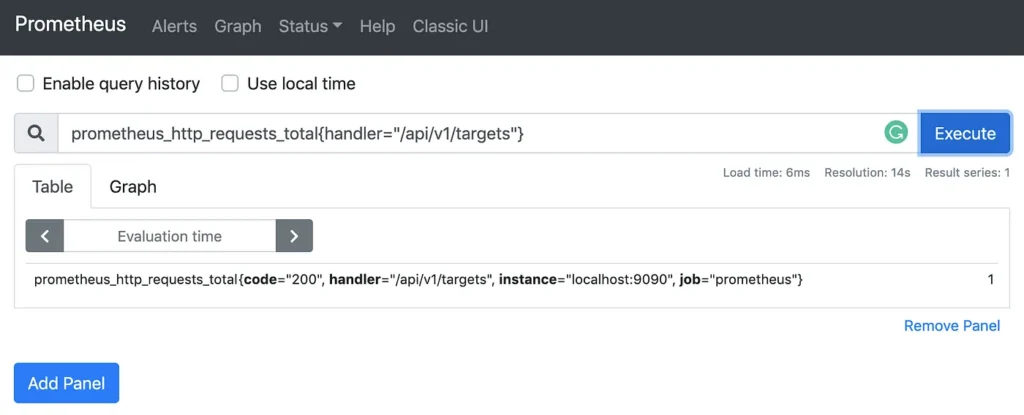
We can filter and aggregate data for a metric based on its dimensions. For example, to retrieve the total number of requests made to the endpoint “/api/v1/targets”, we can use the following label matcher :
prometheus_http_requests_total{handler="/api/v1/targets"}
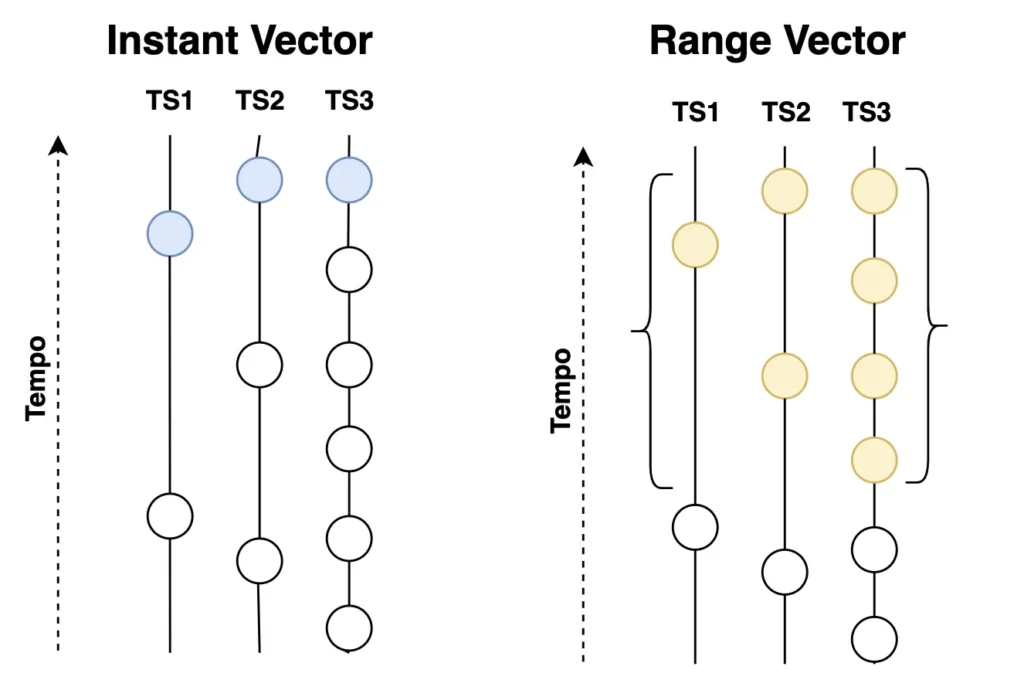
The result of these queries can be divided into four types, but the ones I would like to address here are two: InstantVector It is RangeVector. The first type, instant vector , occurs when we query just by the name of the metric or using the labels as selectors — as done previously — and we can result in a set of time series with a single sample value, the most recent of the metric.
Already the range vector works almost the same way as instant vector , except that it returns a set of samples after the current moment, for example, as samples from the last minute. The interval length defines how far back we want to go back in time to retrieve samples of the metric.
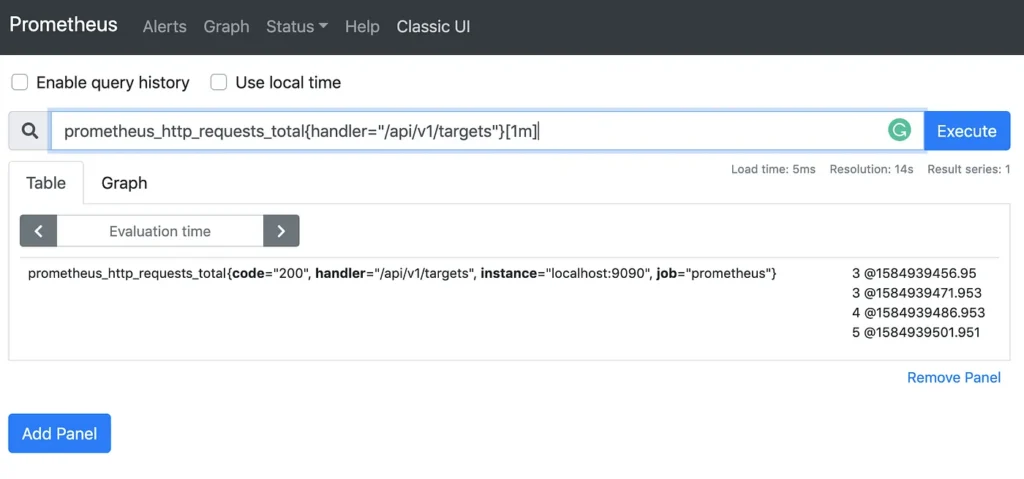
For example, if we want to know a sample of the increase in requests to /api/v1/targets in the last minute:
prometheus_http_requests_total{handler="/api/v1/targets"}[1m]
Types of measurements
After understanding how metrics are represented, let's take a step further and understand what types of metrics are available.
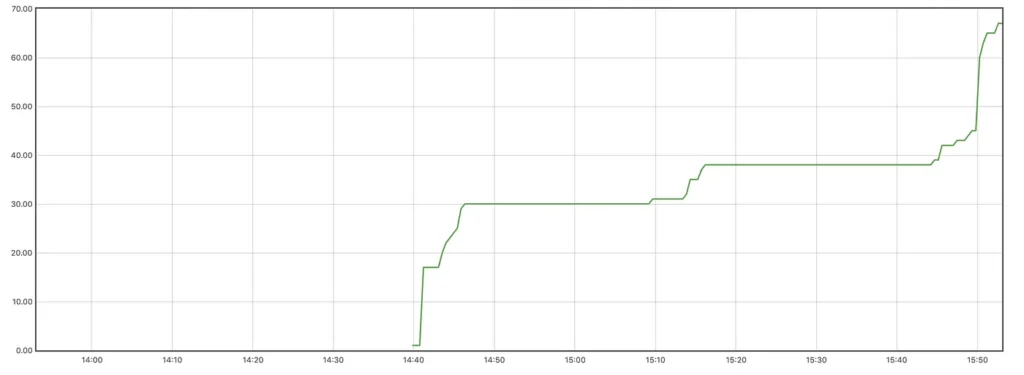
Counter
The accountants counted the total number of some event that occurred since the application was started. For example, the accountants can be used to represent the number of orders, number of requests in a endpoint.
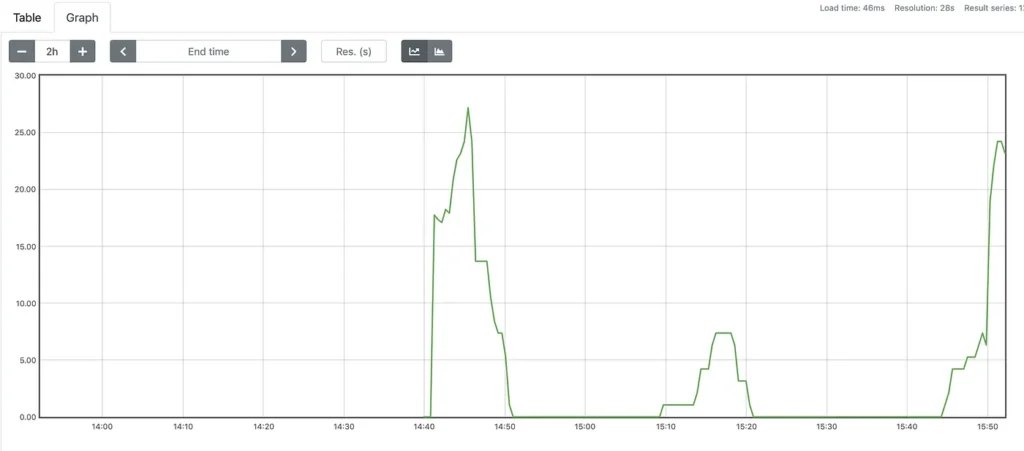
increase(http_requests_total{job="api-server"}[5m])
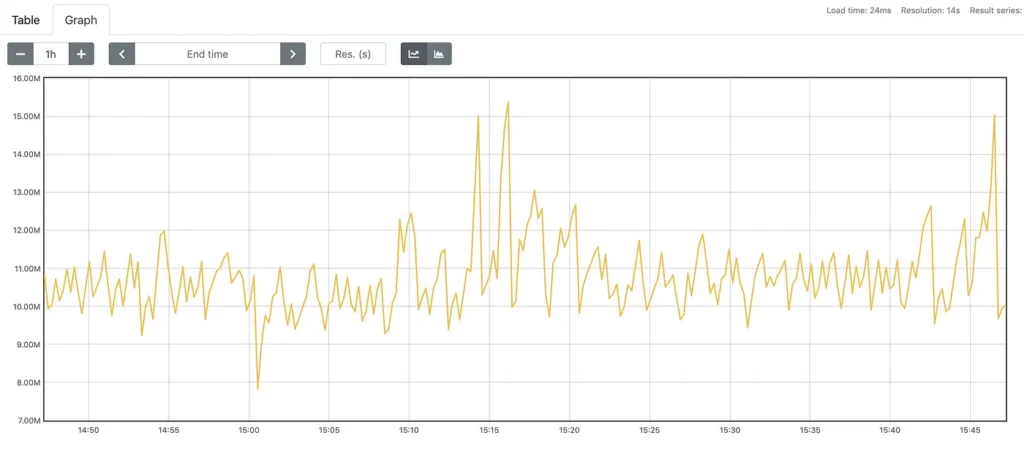
Meter
gauge is a metric that represents a value that can increase and decrease. An example of how you can use meters is the current usage of available memory on an operating system. When used in aggregation queries, we typically use the functions sum , avg , min , It is max .
Histogram and Summaries
These tables are compositions of counters It is allow you to track the distribution of events and the calculation of quantiles for them. For example, when we are analyzing the performance of HTTP request responses (latency) of our services.
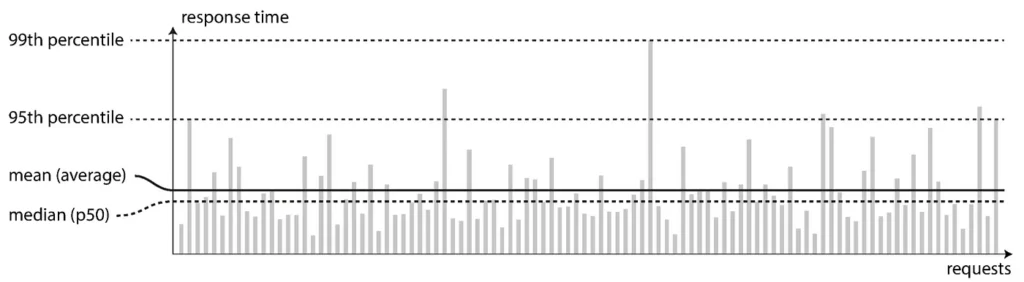
The metrics of histogram have a suffix _bucket in your time series . Each time series has a label called le , which is a counter how many times an event that is smaller than X has happened. To consult this type of information, we use the function histogram_quantile together with the function rate to get the instant interval that we want to monitor.
histograma_quantile(0.9, rate(prometheus_http_request_duration_seconds_bucket[5m]))
Other examples are measuring the distribution of order delivery time in minutes by delivery people, decision-making times for the order routing process, etc.
Already the Summary has the same capabilities as the Histogram , but it also provides a total count — a counter with the suffix _count — and a sum of all observed samples — a counter with the suffix _sum .
Instrumentation
Prometheus works as a white box tool, meaning you need to explicitly define which metrics your application wants to export. In the Prometheus documentation itself, APIs for several languages are presented. If your favorite language runs on the JVM, an interesting option is to abstract the Native API with the use of Micrometer , which provides instrumentation for Prometheus as well as other monitoring tools. For some use cases, such as short-to-live services — such as Spring Cloud Task — the metric display for the Pushgateway needs to be done with the native API.
Conclusions
Prometheus is a tool with great notoriety in the community. Its capabilities and limitations must be well informed for large-scale use. After this introductory reading presented, a suggestion for next steps is to read the references in this text, which contain some interesting insights into topics that have not been explored in depth here.
Thank you and happy reading!
References
Prometheus: up and running: infrastructure and application performance monitoring — https://www.amazon.com.br/dp/B07FCV2VVG/ref=dp-kindle-redirect?_encoding=UTF8&btkr=1
Prometheus reference document- https://prometheus.io/docs/introduction/overview/
https://www.robustperception.io/
PromCon EU 2019: Containing your cardinality – https://www.youtube.com/watch?v=49BGvC1coG4
PromCon 2016: Prometheus Time Series Database – https://www.youtube.com/watch?v=HbnGSNEjhUc
Prometheus Monitoring for Java Developers by Fabian Stäber — https://www.youtube.com/watch?v=jb9j_IYv4cU
Introduction + Deep Dive: Prometheus — Julius Volz, Prometheus and Richard Hartmann, SpaceNet — https://www.youtube.com/watch?v=9GMWvFcQjY
GOTO 2019 • An introduction to monitoring systems and services with Prometheus • Julius Vol — z https://www.youtube.com/watch?v=5O1djJ13gRU
PromCon EU 2019: fun and profit with Alertmanager — https://www.youtube.com/watch?v=VgsM8pOyN5s
PromCon 2018: The life of an alert — https://www.youtube.com/watch?v=PUdjca23Qa4